Friday, October 22, 2010

Using STSADM.EXE to Create Empty Site Collection

There are situations when we want to create empty site collection, like when your content deployment job is failing due to conflicting content. In these cases STSADM.EXE comes handy.

STSADM.EXE is the only means to create a completely empty site collection.


Syntax
STSADM.EXE -o createsite -url -ownerlogin domain\user -owneremail

Example
STSADM.EXE -o createsite -url http://servername:9009/sites/EmptySiteCollectionName -ownerlogin mydomain\praveen -owneremail abc@xyz.com

Remember, using the “Blank Site” template does NOT creates an completely empty site collection. The site collection created by “Blank Site” template create some content for default website.
You can see the difference if you create a site collection using both methods and then inspect the content of the created sites using SharePoint designer.

Wednesday, October 20, 2010

What's New in ASP.NET 4.0 – Better ViewState Control


In ASP.NET 2.0/3.5, you could disable ViewState for individual controls. However what you could not do is disable ViewState at a Page level and then enable it individually for controls on that page that require it. ASP.NET 4.0 changes that and gives more control to developers.

ASP.NET 4.0 introduces the ViewStateMode property that lets you disable ViewState at a Parent level and then enable it for the child controls that require it.
Let’s see this with an example. We will first create a page in ASP.NET 3.5 and disable ViewState on the Parent level and then observe the behavior of ViewState in child controls. We will then use the same example in ASP.NET 4.0 using the ViewStateMode property and observe the changes.
ViewState in ASP.NET 2.0/3.5
Create an ASP.NET application. Place two Label controls and one Button control on the page. Now disable view state on the Page by setting the ‘EnableViewState’ property to false. On the first Label control, set ‘EnableViewState’ property to true as shown below:
<%@ Page Language="C#" AutoEventWireup="true" CodeFile="Default.aspx.cs"
EnableViewState="false" Inherits="_Default" %>
DOCTYPE html PUBLIC "-//W3C//DTD XHTML 1.0 Transitional//EN" "http://www.w3.org/TR/xhtml1/DTD/xhtml1-transitional.dtd">
<html xmlns="http://www.w3.org/1999/xhtml">
<head runat="server">
<title>ViewState Demo in ASP.NET 3.5title>
head>
<body>
<form id="form1" runat="server">
<div>
<asp:Label ID="Label1" runat="server" Text="One" EnableViewState="true">asp:Label><br />
<asp:Label ID="Label2" runat="server" Text="Two">asp:Label><br /><br />
<asp:Button ID="Button1" runat="server" Text="PostBack" />
div>
form>
body>
html>
In the code behind file, write the following code which set’s the text of the Label controls:
C#
protected void Page_Load(object sender, EventArgs e)
{
if (!IsPostBack)
{
Label1.Text = "Label1 Changed";
Label2.Text = "Label2 Changed";
}
}
VB.NET
Protected Sub Page_Load(ByVal sender As Object, ByVal e As EventArgs)
If (Not IsPostBack) Then
Label1.Text = "Label1 Changed"
Label2.Text = "Label2 Changed"
End If
End Sub
Now what is ‘ideally’ expected out of this setup is that although ViewState is disabled for the entire page, yet Label1 should save ViewState and retain its new value ‘Label1 Changed’ after postback; since ViewState is explicitly enabled on it.
Run the application.
Before PostBack
Postback4-1
After PostBack
Postback1
You will observe that on hitting the button (causing a postback), Label1 does not retain the value (Label1 Changed) explicitly set on it. Not as we expected!
ViewState in ASP.NET 4.0
We will now create a similar web application in ASP.NET 4.0. The only difference is that here we will use the new ‘ViewStateMode’ property.
The ViewStateMode property accepts three values: Enabled, Disabled, andInherit.
Enabled - enables view state for that control and any child controls that are set to ‘Inherit’ or that have nothing set.
Disabled - disables view state
Inherit - specifies that the control uses the ViewStateMode setting from the parent control.
The markup looks similar to the following:
<%@ Page Language="C#" AutoEventWireup="true" CodeFile="Default.aspx.cs"
ViewStateMode="Disabled" Inherits="_Default" %>
DOCTYPE html PUBLIC "-//W3C//DTD XHTML 1.0 Transitional//EN" "http://www.w3.org/TR/xhtml1/DTD/xhtml1-transitional.dtd">
<html xmlns="http://www.w3.org/1999/xhtml">
<head id="Head1" runat="server">
<title>View State Demo in ASP.NET 4.0title>
head>
<body>
<form id="form1" runat="server">
<div>
<asp:Label ID="Label1" runat="server" Text="One" ViewStateMode="Enabled">asp:Label><br />
<asp:Label ID="Label2" runat="server" Text="Two">asp:Label> <br /><br />
<asp:Button ID="Button1" runat="server" Text="PostBack" />
div>
form>
body>
html>
Observe that ViewStateMode on the Page is set to Disabled. The child Label1 control has ViewStateMode set to Enabled, so Label1 ‘ideally’ should save view state. Since the ViewStateMode property is not set on Label2 , so the Label2 control inherits this property value from its parent (Page) and therefore saves no view state.
Note: The default value of ViewStateMode is Enabled for Pageobject. The default value of ViewStateMode is Inherit for controls.
Run the application and hit the button. What do you expect now?
When the page first loads, both the Label controls display the text as set in the codebehind file.
Before PostBack
Postback2-1
However, after hitting the button and causing a postback, Label1 does retain its value as we had expected!
After PostBack
Postback3-1
This is a welcome change as now we can disable ViewState on a parent level and enable it only for those child controls that require it. This improves performance with lesser efforts and gives us more control. This was however just a demo. You will realize maximum advantage of this new feature in a Master-Content page scenario by setting ViewStateMode to Disabled for the Master page and then enable it individually in Content Pages, or individually on controls that require view state.

Wednesday, October 13, 2010

installing MOSS 2007 SharePoint farm

MOSS 2007 can be installed as a Stand-alone Server application or as a Server farm or as a Web Front End. MOSS 2007 installs WSS v3.0 automatically.

If you have only one server, you have no option but to install Stand-alone Type, this will install desktop database engine (SQL Server 2005 Express Edition) along. It will be an independent instance of SQL Server just for the SharePoint application. But this will result in very poor performance. And can only be used by a very small user group or just for learning purpose.

If you have to use it in a relatively larger setup you must install SharePoint farm (atleast one Complete - Install all components Server Type) with database on a different dedicated database server.

In this post I will show the steps for installing MOSS 2007 SharePoint farm:

Prerequisites: Please read this before installing Beta 2

Step 1: Start the installation by clicking the Setup.exe in the x86/x64(for 64 bit machine), and the installation starts with the following screen. Select the Complete Server Type option and click the Install Now button. This will take few minutes and will install the basic components.

Step 2: After the installation of basic components, it will automatically start the SharePoint Products and Technologies Wizard. This Wizard can even be started from the Start-->All Programs-->Microsoft Office Server-->SharePoint Products and Technologies Wizard link also. This will present a Welcome screen, Click the Next > button

Step 3: Next screen will be of Connect to a server farm, if it is the first server in the farm select the option "No, I want to create a new server farm" and if there are already one or more existing server, you can select either of the option "Yes, I want to connect to an existing server farm" or "No, I want to create a new server farm", Click the Next > button

Step 4: In this step specify the Configuration Database Settings. Do remember if your configuration database is hosted on another server, you must specify a domain account (Global Domain Account), Click the Next > button

Step 5: Next step is to Specify the port number for the SharePoint Central Administration Web Application. details of Web Application and the port number can be read from the following screen shot, Click the Next > button

Step 6: Finally it will show the Configuration Successful screen, Click the Finish button

Step 7: This will open up the Central Administration homepage in the browser.

Step 8: In the Administrative Tasks as shown in the above screen-shot, Click on the "Initial Deployment: Assign Services to Servers" link, this will open-up the following page, Click the Action Link "Initial Deployment: Assign Services to Servers"

Step 9: It will open-up the following screen, just make sure you start all highlighted services in the list(or atleast the one shown as Started here) :

Step 10: Now go back to the Home-page as shown in Step 7 and click the "Application Management" tab, this will open-up the following screen, Now since Services on Server are started, "Create or extend Web application" will be displayed. Click the link.:

It will further show the following page, continue with the "Create a new Web Application" link:

Step 11: Now the Create New Web Application Screen will open. Fill the appropriate values. By default it will show some Port number but since I wanted to host the application on 80 port I changed it to 80. Also there please remember the following

Notes:

  1. In the Load Balanced URL section change the name of the server to the IP of the server in the URL, by doing this you will not require do DNS settings, if otherwise you can continue with the server name also,
  2. In the Application Pool section select a configurable security account. I have given my security account ID. In my case both Predefined options(Network Service/Local Service) didn't worked and gave error.

Step 12: You will get the following screen on completion of Step 11. Now Click the "Create a new Windows SharePoint Services site collection." link

Create the site collection and that's it.

You can create multiple Web-Applications(at different Port) and multiple Site-Collections in every Web-Application.

Thursday, October 7, 2010

SharePoint 2007 - Simple Task Dashboard


example of creating a simple Task Dashboard. This is a pretty basic example of using all OOTB (out of the box) features and combining them to quickly build a solution.

Scenario:

  • We want to provide a way for users to easily see a summary of the current project tasks.
  • We want them to be able to see the following information:
    • Open Tasks Assigned to Them
    • Overdue Tasks
    • Tasks Due This Week
    • Task Calendar
    • Tasks Assigned to Others

Solution:

To build this solution we will be using several different tools available in SharePoint, all included in the list below:

  • Task List
  • Task List Views
    • We will create views for each of the different ways we want to see the data displayed on our dashboard.
  • Web Part Page
  • List View Web Parts
  • Custom Navigation

The first thing we will do is create our task lists and then configure all the views that we need. To create the list, go to View All Site Content, Create and then select the Task list.

Next, we will need to configure our custom views. To do this, we can select the view drop down and select to create new views.

Now, we just need to give our view a name and set the specific criteria.

Below is a table that describes the configuration for the different views we are creating for this example:

View

Description

Image

Open Tasks Assigned to Them

Show all open tasks that are assigned to me.

Overdue Tasks

Show all open tasks that the due date is less than today.

Tasks Due This Week

Show all tasks that are due in the next 7 days.

Task Calendar

Show the tasks in a calendar format that shows the start and end date as the duration.

Tasks Assigned to Others

Show all the tasks grouped by the person they were assigned to and the status.

Now that we have the views created, we will create the web part page. We are creating this web part page to give us some more real estate to display the data. We could in theory add the web parts to the home page; however we want to be careful not to get our home page too cluttered. Since we don't want to clutter the home page, the web part page is a good alternative. Once we have the page created, we will simply add it is a tab to our home site so users can easily access it. To create the web part page go to view all site content and then create (same steps that we used to create the task list). This time on the selection page we will choose to create a web part page.

On the creation page you will need to give the page a name, select a layout and also select the library that will be used to store the list. Every web part page you create must be stored in a document library. If you are going to create many pages, or if you think having the page in an existing library would be confusing, you could create a library dedicated to storing only web part pages.

Now that we have the page created, we can simply add our web parts to the page and select the view that we want to be displayed in each of the web parts. We can also modify the Title Bar properties to change the page title, image and add a caption.

Here are the steps that would need to be repeated for each web part you add to the page:

  1. Add the Web Part
  2. Modify the Properties to change the View and the Web Part Title

Here is a screenshot of the finished Dashboard page.

And here is the page in edit view to show how the web parts have been arranged on the page.

As a final last step, we are going to add a link to this page to the global navigation for the site. To access the settings, go to the site settings page and then select the navigation link. We are working with a site that has publishing enabled, so our link is for navigation. If you don't have publishing enabled you will want to use the Top Link Bar link.

Once this step has been completed, you will be able to easily access the Task Dashboard using the global navigation.

Tuesday, October 5, 2010

KPI in Sharepoint 2007

We all know about the importance of goal in business. Business works on set goals, so it is very important to track where they are, matching the goal, ahead of goal or behind the goal. To answer this question, SharePoint has come up with feature called KPI (Key Performance Indicator).

Key Performance Indicator as name suggests, it gives an idea about where we are performing related to goal. They are found in Report center site, so if you are in WSS working environment, do not think of using this feature because you are not going to get this. This is moss feature.

So let’s get started and understand how it works.

KPI is a special type of list, so while creating a list; we need to select this special list as KPI list, not a normal custom list. When you create a KPI list, then click new, you will see the difference. This is the difference.

Here is a sample of creating KPI list and how the data is entered in it. So first we will create a normal list which will hold the data that will be used in KPI list. Create a list as shown below.


Now observe here that we have sales goal against January of each year. Keep this thing as of now in your mind.

Let us go back to KPI list, Create KPI list and name it as you like.

Once you are done with creation, just click on new and observe the change, here you can see four options.
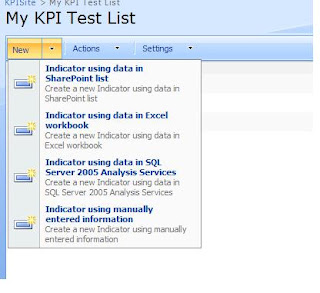


As you can see, first options says you can create KPI using list options, second option says that you can create KPI using excel workbook, third says that you can create KPI using Sql server 2005 analysis services and the last options says that you can create KPI using manual entry.

We are going to see three out of these four. We will not cover analysis service KPI. We will cover rest of it.

So let us get started and try to create KPI from List option. So click on the first option, once you click on it, it will take you to a page where you can enter the List url from which we want to fetch the data, select the list that we created earlier and click on number of list items in view. Scroll below and enter 8 and 6 respectively like shown below.
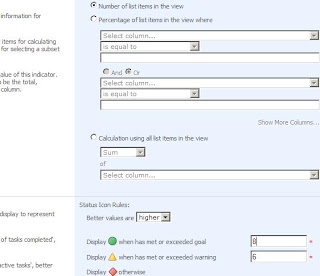


Let me explain you what all settings we just did. We have counted the number of items in the list. If total number of items in the list meets criteria of 8 or above, KPI gives green symbol. If total number of items in the list is 6 or 7 then it gives us yellow triangle. If total number of items is below 6 than it gives red square symbol.

So let us go back and see how many items we have in list, we have five items entered in it.


Now let’s go ahead and add more two rows in the list.
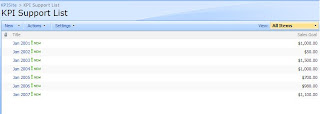


Now go back to KPI list and refresh the page and see symbol changes to the yellow triangle that meets to our criteria.


Now go back and add one more item to it to complete our goal of 8 items in the list and that will turn our KPI symbol to green circle.


That completed our simple example of generating KPI based on total number of items in the list. If you have observed while creating KPI, you must have seen other two options as well. It says that you can also go for the percentage value. Other is calculating average, calculating sum etc kind of a function. We will go for calculating average sales. So let’s add one more KPI which is again from List data. So click on new and select KPI from list option. In the page, shown name the KPI and then select third radio button. Select your list by specifying URL and selecting view as All items, here you can also mentioned your specific view for which you want to generate KPI, so this gives us more flexibility for criteria based KPI as well. After this select column as “Sales Goal” and select average from the drop down. Provide 1000 in the goal and 600 in warning textbox. You should have something which looks similar to shown below.
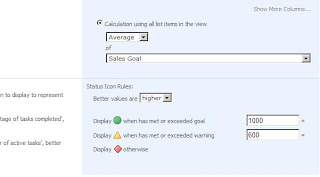


We have specified that if the average sale is 1000 or more, we are safe and it shows green symbol. If it’s between 600 to 999, we are in a warning stage else we are in danger zone and indicated by red square.

Here we have this entry in our base list.
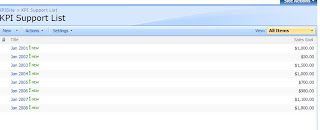


Because average sales is higher than we specified (which is $1,000 in our case), KPI indicator shows us green symbol.


To know more on the same KPI, just click on the KPI item that we have just created; it will take you to a page which shows more detailed information.
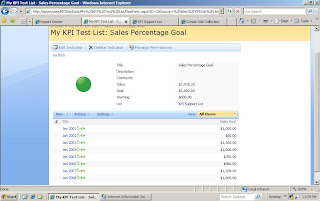


Now, go ahead and change the sales values accordingly. When you change the value which makes the average change in them, when average goes below 999 it will start showing yellow triangle and if average changes below 600, it will start showing red square.

Ok, now let us start analyzing the other options which is entering manual information KPI, it is very simple process of giving static data. You just need to give a value and select the criteria goal for it and it simple displays the image depending on the value that you have entered like shown below.

You can also create a KPI indicator which will come from the excel file. But before starting on this, you need to create SSP for this, because the excel file that we are going to use here must be under the trusted location. So create the SSP from central administration and click on the excel trusted file location. Give the entire path till your library name in which your excel book resides. Once you are done with this, then only you will be able to use this feature. So go ahead and create one more KPI indicator and this time select the indicator using data in excel work book. Once you click on this, you need to give the URL of the workbook. So go ahead and select your work book. Now here, once you select the workbook, you need to give the cell number here to mention your indicator value. Along with this you also need to give the cell number for goal and cell number for warning.

This is the snapshot of excel workbook that I have created. In this workbook, in Shhet1 I have mentioned Sales data.
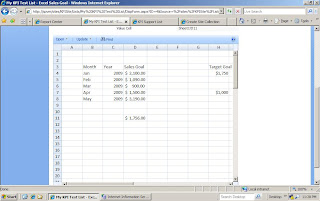


Here D11 cell is an average of sales goal value of D4 to D8 which is our target value as indicator. H$ value indicates the goal to achieve and H7 is the warning sales goal. So let’s specify these values in respective field as shown below.
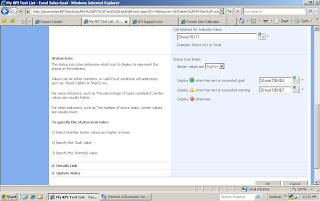


Just see at the indicator field in KPI list,

Let’s prepare one workbook which look like this, here D11 is calculated column which is average of all sales figures. Cell H4 represents the goal to be achieved and cell H6 represents the warning match.

So here we will specify our criteria like shown above in workbook figure.

Go ahead and have a look at the KPI list how it looks like.
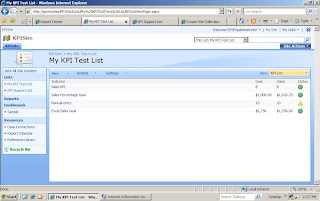


Try to open the workbook for editing and see the changes in the indicator values, you will see different indicators shown in the KPI list.

Now, we are almost done with our examples of KPI. Just one more topic left to discuss which a KPI web part is. We are done with creating KPI list, its supporting list but there is one more thing, which is web part that supports the KPI list. So let’s go ahead and add web parts. Click on edit page, where you want to put this web part. This web part will basically pulls the KPI data from the KPI list and shows details at one go.

Find web part which is named “Key Performance indicators” under Dashboard category. Once you add it, click on modify shared web part and select the KPI list.
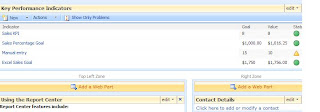


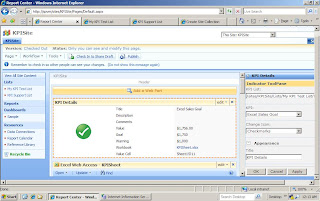
One more web part is there which says KPI Details under same Dashboard category. So go ahead and add that web part on the page, click on modify shared web part. Select KPI list, here you will find all KPIs that you have mentioned in the KPI list in the drop down. From there you can select KPI. In this example, I have selected the excel sales data calculation KPI and selected icon as checkmark and result is shown below.


That is it. i will soon come with part 2.

Popular Posts

Recent Posts

Unordered List

Text Widget

Blog Archive