Fuzzy Grouping Transformation Sample
Fuzzy Grouping Transformation
Fuzzy Grouping Transformation
Use of fuzzy grouping
I wanted to learn, how to use Fuzzy grouping transformation. But I was not getting any scenario, where this transformation could be used. Then while going through Google search, I got some scenario in which this transformation can be used. The scenarios are as follows:
· Scenario1: Say there are various clothes shops in a market. Some sales man sells cloths in shops. One wants to get the salesman, who has sold maximum clothes. For this the records of sale for each salesman in shop1 and shop2 is as follows:
Shop1: shop2: 
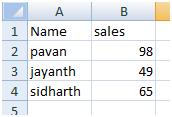
But there are some names, which misspelled .For getting the total sale of each salesman, we will need to use fuzzy grouping, which will group the names which are similar and will assign a common name to the similar names, so after that we can aggregate the sales of each salesman by that common name.
For example; jayant and jayanath are similar, in which one of name misspelled. So the total sale of jayant (jayanth ) is 107.
· Another scenario can be, when country name is misspelled or if company names misspelled etc.
Implementation of Fuzzy Grouping Transformation
Here I am going to implement the first scenario1, in which we will be doing fuzzy grouping of shop1 and shop2 by Name, and will calculate the total sales made by each salesman. So the result should look like

For implementation, I have followed below steps:
Step1: Add a DFT in your package

Step 2: For source, I have used one excel connection for shop2, and one Oledb connection for Shop1.
I did this, so that we can make this scenario a bit difficult, and we could learn some more.
Before using OleDB connection, let’s create the table and insert the data in SSMS, as below


For using Excel connection insert data of shop2 into one excel sheet of an excelfile

Now we will add Oledb source and Excel source in the DFT, and will configure both


Step3: Union all records of both the shops
As we want to union the records of both the shops, so that we can apply fuzzy grouping on all the records of both shops.
For this, we need to use ‘Union All’ Transformation. But for doing Union, both the source should have same data type for their columns. For making the data type of the mapping columns similar, I am using Derived Column Transformation for both the source.

Now we will be typecasting column Sales of both the shops into one data type(in Derived column transformation) for this double click on derived column transformation, and then add one derived column say ‘sales1’ and set expression , as shown below:

Where (DT_R8)sales means, we are type casting sales column of each to DT_R8 data type, which is nothing but double precision float data type. This is one for both source’s column sales.
Now, we can apply on both the shops, Union All editor looks like below:

Step 4: Add Fuzzy grouping transformation and double click on it and go ‘Coulmn’ tab


In the columns tab,
check the checkbox on left of the column, for applying fuzzy matching on that column, here I have check the checkbox of name, that means the fuzzy matching will be applied on name column, as you can see match type as ‘Fuzzy’.
Check the checkbox on right of the column (ie; Pass through), for using those columns in your result. As here I have checked column sales, because in the result we want to get total sale of each sales man , so this column will also be used.
In the Advanced tab
We can set the similarity threshold, token delimiters, etc.
· Similarity threshold as 0.80: that means only matches which are at least 80% similar to the searched will only be displayed.
· Token Delimiter: This is default set, as shown below. The delimiters below will break each sentence into multiple words if they found the delimiters, and then the matching will be done.
· _key_in, a column that uniquely identifies each row.
· _key_out, a column that identifies a group of duplicate rows. The _key_out column has the value of the _key_in column in the canonical data row. Rows with the same value in _key_out are part of the same group. The _key_outvalue for a group corresponds to the value of _key_in in the canonical data row.
· _score, a value between 0 and 1 that indicates the similarity of the input row to the canonical row.

Step 5: Add Aggregate transformation, Excel Destination
Aggregate transformation is used for getting the aggregate sum of sale per person.
Before that add a ‘Data Viewer’ on the connector of Fuzzy grouping and Aggregate transformation. So that we can see some result from fuzzy grouping.

Configure the Aggregate transformation

Apply operation sum on Sales column, and Group by on Name_Clean. That means, sales will be sum by Name _Clean. Where Name_Clean is the column generated by fuzzy transformation, along with name, s ales etc., which contains value of name which are part of the same group. Rows with the same value in _key_out are part of the same group.
Step 6: Execute DFT.
After Fuzzy grouping, one Data viewer is used, which gets popup while execution. Here in the Data view we can see that, Name_Clean is Jayanth for both ‘jayant’ and ‘jayanth’. Similarly Name_Clean is ‘sidhart’ for both ‘sidharth’ and ‘sidhart’.

When we continue execution, then one more data viewer is in the connector between Aggregate transformation, and Excel Destination. That data view gets pop up

That shows the result after aggregate, as Sidhart has total 107 sales, and jayanth has 154 sales
This is how the whole task executes, and stores the result in Excel destination


0 comments:
Post a Comment