Creating a KPI list based on a SharePoint list.
SharePoint as a business tool can be utilized for displaying data for the end users. And not just displaying the data, but displaying it in brief so that the users get to know the overall scenario without getting down to the basics. For these reasons, I have always liked SharePoint.
Key Performance Indicator (KPI) is financial and non-financial metrics used to help an organization define and measure progress toward organizational goals. KPIs can be delivered through Business Intelligence techniques to assess the present state of the business and to assist in prescribing a course of action.

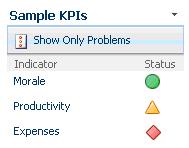
Sample KPI list
Consider the following scenario:
You have a company where the performance is based on Surveys that the users provide for the product/company. The Company Director would like the survey data targets to be displayed on the home page of a report site on the SharePoint web application. Now, there are four parameters that need to be displayed on the KPI list.
- Top Area [Overall survey points including all the parameters. The total point are 10 and if the user give a overall survey of equal to or greater than 8 points, then that would be considered under this parameter]
- Bottom Area [This is opposite of Top Area. Now if the end user give a overall score of equal to or less than 4 points, then that would be considered under this parameter]
- Product Quality [This is the individual rating the end user gives about the product that they are using. This is also a score out of 10 points. If the user gives a score of equal to or greater than 8 points then that would be counted positive under this category or else for any value less than 8, it would be considered as negative]
- Engineer Knowledge [This is the individual rating the end user gives based on what they think about the support engineer/executive/customer service agent that they has a talk with. This is also a score out of 10 points. If the user gives a score of equal to or greater than 8 points then that would be counted positive under this category or else for any value less than 8, it would be considered as negative]
The above scenario is just an example so that we can develop out KPI list. The scenario may depend on the company requirement.
e.g. A sales company may want to display the sales that are done for different products in different areas. As per the definition of KPI, it is not necessary that we display only financial data. We can display any data where target is in picture. E.g. if a department want to meet 75% of total product sales in a specific region, we can create a KPI list that can show the current status of the sales as per the data that is present in a SharePoint list / database / external source like XML. In this tutorial, we will first continue with using another SharePoint lists as the data source for generating the KPI list.
So, now that we have an understanding of the scenario, let us get started with the actual work.
- I have created a collaboration portal site which by default creates a “Reports” sub site under the top level site. We can even use a team site or a blank site template to start with. But there might be features that are required for a specific web part to function properly. For these reasons, I tend to start off with a publishing site template and then test it with other templates.
- Browse to the “Reports” site and click on “View All Site Content” in the quick launch bar. Select the Create button in the Actions menu bar.

- Create Site Content
- Create a list. I am using the Custom List, so that I can have the columns as per the report requirements.

- Creating Custom List
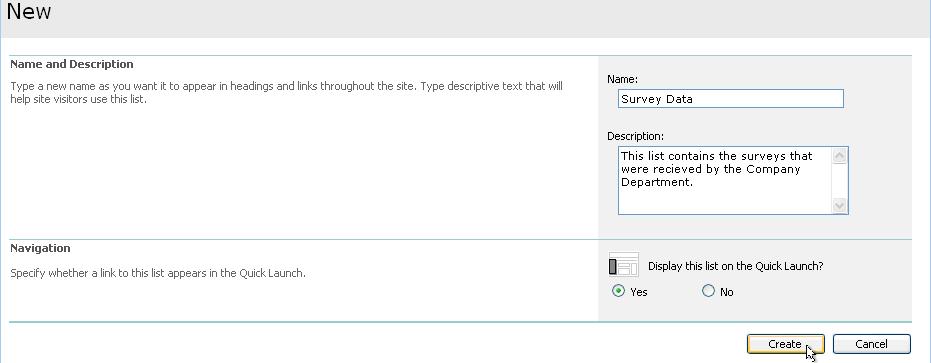
- Enter the description of the custom list and click on “Create” button.

- Survey Data – Custom List Details
- Now to add the custom columns, we need to click on “Settings” button in the Actions menu bar of the list and go to “List Settings”.

- Survey Data – List Settings
- Under the columns section, select “Create Column” and create the following columns in the list.

- Survey Data – Columns
The Engineer column is a lookup column that is pulling out data from other list [which contains the engineer details. This concept in SharePoint is called re-usability, where a list can contain general data and that can be used in multiple locations. Thus the end-user does not have to always feed in the data for the individual items. The list automatically pulls out the data that is present and the user just have to select the item from the list.]
- Once we have the above columns created, we will add some items in the “Surveys” list. This data will be used for getting the KPI on out site. After filling in some items, the list should look somewhat like this.

- Survey Data – List Items
- Now that we have the data filled in the list, we need to create a KPI list in the site. So, once again , we will browse to the “View All Site Content” of the Reports Site and select the “Create” Option. This time, select the “KPI list” under the custom list section and fill in the details to create a KPI list. Now, we have already been through the process of creating a list, so I am keeping it short this time.
- Once the list is created, it should look like this.

- Survey KPI – Blank List
- Select, New -> Indicator using data in SharePoint list

- Creating a new KPI item
- Put the following settings for the KPI item
Name : Top Area
Description : This KPI displays the performance indicator for the top area.
List Url : Select the “Survey Data” list from the list locator. The url should be
/Reports/Lists/Survey Data/AllItems.aspx
Under the “Value Calculation” section, Keep the option – “Percentage of list items in the view where” selected as we are going to show the data in percentage format on the KPI.
Select the “Overall” column -> is greater than or equal to -> 8 [Here, “8” is the value which defines the limit. If the Overall score of the survey is greater than “8” then the survey data will be counted under the Top Area parameter.]
Moving on to the next section [Status Icon], select the following settings:
Better values are : greater
Display
Display
Display
- Leave the other settings as default and click on “OK” button.
Now, this was an example for the “Top Area” KPI parameter. Similarly, I have created 3 more KPI items for the bottom area, engineer knowledge and product quality. Now all these items have their own logic as the one above. Depending on the scenario, you can create your own KPI items.

- Final Survey KPI list view
Now, you have your KPI list ready and working. The only thing that might be missing is to display the list on your home page of the Report site. For that you need to browse to the home page of the Report Site -> Site Actions -> Edit Page -> Click on “Add a web part” on a zone of your choice.

- KPI Web Part

0 comments:
Post a Comment