KPI in Sharepoint 2007
We all know about the importance of goal in business. Business works on set goals, so it is very important to track where they are, matching the goal, ahead of goal or behind the goal. To answer this question, SharePoint has come up with feature called KPI (Key Performance Indicator).
Key Performance Indicator as name suggests, it gives an idea about where we are performing related to goal. They are found in Report center site, so if you are in WSS working environment, do not think of using this feature because you are not going to get this. This is moss feature.
So let’s get started and understand how it works.
KPI is a special type of list, so while creating a list; we need to select this special list as KPI list, not a normal custom list. When you create a KPI list, then click new, you will see the difference. This is the difference.
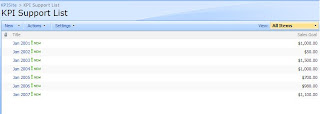
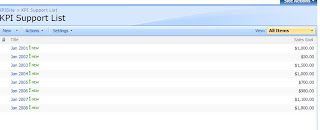
Here is a sample of creating KPI list and how the data is entered in it. So first we will create a normal list which will hold the data that will be used in KPI list. Create a list as shown below.
Now observe here that we have sales goal against January of each year. Keep this thing as of now in your mind.
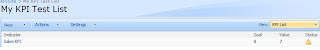
Let us go back to KPI list, Create KPI list and name it as you like.
Once you are done with creation, just click on new and observe the change, here you can see four options.
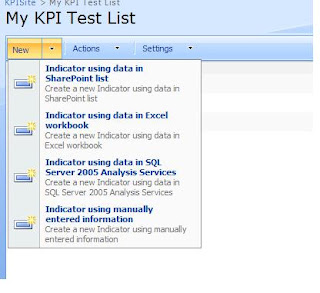
As you can see, first options says you can create KPI using list options, second option says that you can create KPI using excel workbook, third says that you can create KPI using Sql server 2005 analysis services and the last options says that you can create KPI using manual entry.
We are going to see three out of these four. We will not cover analysis service KPI. We will cover rest of it.
So let us get started and try to create KPI from List option. So click on the first option, once you click on it, it will take you to a page where you can enter the List url from which we want to fetch the data, select the list that we created earlier and click on number of list items in view. Scroll below and enter 8 and 6 respectively like shown below.
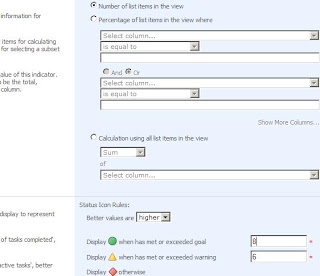
Let me explain you what all settings we just did. We have counted the number of items in the list. If total number of items in the list meets criteria of 8 or above, KPI gives green symbol. If total number of items in the list is 6 or 7 then it gives us yellow triangle. If total number of items is below 6 than it gives red square symbol.
So let us go back and see how many items we have in list, we have five items entered in it.
Now let’s go ahead and add more two rows in the list.
Now go back to KPI list and refresh the page and see symbol changes to the yellow triangle that meets to our criteria.
Now go back and add one more item to it to complete our goal of 8 items in the list and that will turn our KPI symbol to green circle.
That completed our simple example of generating KPI based on total number of items in the list. If you have observed while creating KPI, you must have seen other two options as well. It says that you can also go for the percentage value. Other is calculating average, calculating sum etc kind of a function. We will go for calculating average sales. So let’s add one more KPI which is again from List data. So click on new and select KPI from list option. In the page, shown name the KPI and then select third radio button. Select your list by specifying URL and selecting view as All items, here you can also mentioned your specific view for which you want to generate KPI, so this gives us more flexibility for criteria based KPI as well. After this select column as “Sales Goal” and select average from the drop down. Provide 1000 in the goal and 600 in warning textbox. You should have something which looks similar to shown below.
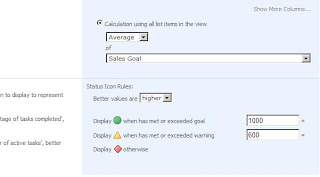
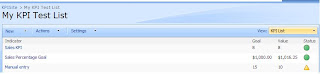
We have specified that if the average sale is 1000 or more, we are safe and it shows green symbol. If it’s between 600 to 999, we are in a warning stage else we are in danger zone and indicated by red square.
Here we have this entry in our base list.
Because average sales is higher than we specified (which is $1,000 in our case), KPI indicator shows us green symbol.
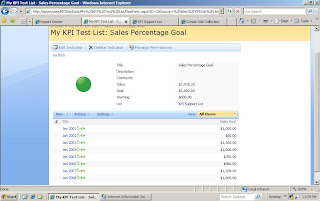
To know more on the same KPI, just click on the KPI item that we have just created; it will take you to a page which shows more detailed information.
Now, go ahead and change the sales values accordingly. When you change the value which makes the average change in them, when average goes below 999 it will start showing yellow triangle and if average changes below 600, it will start showing red square.
Ok, now let us start analyzing the other options which is entering manual information KPI, it is very simple process of giving static data. You just need to give a value and select the criteria goal for it and it simple displays the image depending on the value that you have entered like shown below.
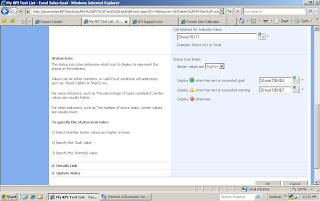
You can also create a KPI indicator which will come from the excel file. But before starting on this, you need to create SSP for this, because the excel file that we are going to use here must be under the trusted location. So create the SSP from central administration and click on the excel trusted file location. Give the entire path till your library name in which your excel book resides. Once you are done with this, then only you will be able to use this feature. So go ahead and create one more KPI indicator and this time select the indicator using data in excel work book. Once you click on this, you need to give the URL of the workbook. So go ahead and select your work book. Now here, once you select the workbook, you need to give the cell number here to mention your indicator value. Along with this you also need to give the cell number for goal and cell number for warning.
This is the snapshot of excel workbook that I have created. In this workbook, in Shhet1 I have mentioned Sales data.
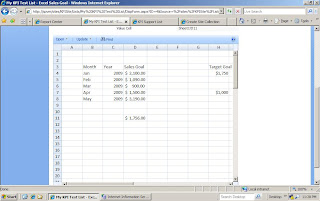
Here D11 cell is an average of sales goal value of D4 to D8 which is our target value as indicator. H$ value indicates the goal to achieve and H7 is the warning sales goal. So let’s specify these values in respective field as shown below.
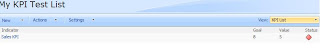
Just see at the indicator field in KPI list,
Let’s prepare one workbook which look like this, here D11 is calculated column which is average of all sales figures. Cell H4 represents the goal to be achieved and cell H6 represents the warning match.
So here we will specify our criteria like shown above in workbook figure.
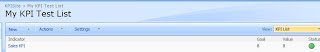
Go ahead and have a look at the KPI list how it looks like.
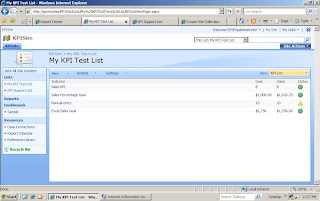
Try to open the workbook for editing and see the changes in the indicator values, you will see different indicators shown in the KPI list.
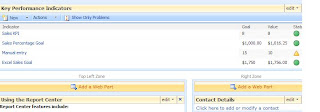
Now, we are almost done with our examples of KPI. Just one more topic left to discuss which a KPI web part is. We are done with creating KPI list, its supporting list but there is one more thing, which is web part that supports the KPI list. So let’s go ahead and add web parts. Click on edit page, where you want to put this web part. This web part will basically pulls the KPI data from the KPI list and shows details at one go.
Find web part which is named “Key Performance indicators” under Dashboard category. Once you add it, click on modify shared web part and select the KPI list.
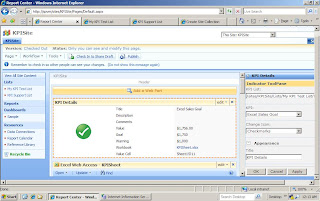
One more web part is there which says KPI Details under same Dashboard category. So go ahead and add that web part on the page, click on modify shared web part. Select KPI list, here you will find all KPIs that you have mentioned in the KPI list in the drop down. From there you can select KPI. In this example, I have selected the excel sales data calculation KPI and selected icon as checkmark and result is shown below.
That is it. i will soon come with part 2.
Key Performance Indicator as name suggests, it gives an idea about where we are performing related to goal. They are found in Report center site, so if you are in WSS working environment, do not think of using this feature because you are not going to get this. This is moss feature.
So let’s get started and understand how it works.
KPI is a special type of list, so while creating a list; we need to select this special list as KPI list, not a normal custom list. When you create a KPI list, then click new, you will see the difference. This is the difference.
Here is a sample of creating KPI list and how the data is entered in it. So first we will create a normal list which will hold the data that will be used in KPI list. Create a list as shown below.

Now observe here that we have sales goal against January of each year. Keep this thing as of now in your mind.
Let us go back to KPI list, Create KPI list and name it as you like.
Once you are done with creation, just click on new and observe the change, here you can see four options.

As you can see, first options says you can create KPI using list options, second option says that you can create KPI using excel workbook, third says that you can create KPI using Sql server 2005 analysis services and the last options says that you can create KPI using manual entry.
We are going to see three out of these four. We will not cover analysis service KPI. We will cover rest of it.
So let us get started and try to create KPI from List option. So click on the first option, once you click on it, it will take you to a page where you can enter the List url from which we want to fetch the data, select the list that we created earlier and click on number of list items in view. Scroll below and enter 8 and 6 respectively like shown below.

Let me explain you what all settings we just did. We have counted the number of items in the list. If total number of items in the list meets criteria of 8 or above, KPI gives green symbol. If total number of items in the list is 6 or 7 then it gives us yellow triangle. If total number of items is below 6 than it gives red square symbol.
So let us go back and see how many items we have in list, we have five items entered in it.

Now let’s go ahead and add more two rows in the list.

Now go back to KPI list and refresh the page and see symbol changes to the yellow triangle that meets to our criteria.

Now go back and add one more item to it to complete our goal of 8 items in the list and that will turn our KPI symbol to green circle.

That completed our simple example of generating KPI based on total number of items in the list. If you have observed while creating KPI, you must have seen other two options as well. It says that you can also go for the percentage value. Other is calculating average, calculating sum etc kind of a function. We will go for calculating average sales. So let’s add one more KPI which is again from List data. So click on new and select KPI from list option. In the page, shown name the KPI and then select third radio button. Select your list by specifying URL and selecting view as All items, here you can also mentioned your specific view for which you want to generate KPI, so this gives us more flexibility for criteria based KPI as well. After this select column as “Sales Goal” and select average from the drop down. Provide 1000 in the goal and 600 in warning textbox. You should have something which looks similar to shown below.

We have specified that if the average sale is 1000 or more, we are safe and it shows green symbol. If it’s between 600 to 999, we are in a warning stage else we are in danger zone and indicated by red square.
Here we have this entry in our base list.

Because average sales is higher than we specified (which is $1,000 in our case), KPI indicator shows us green symbol.

To know more on the same KPI, just click on the KPI item that we have just created; it will take you to a page which shows more detailed information.

Now, go ahead and change the sales values accordingly. When you change the value which makes the average change in them, when average goes below 999 it will start showing yellow triangle and if average changes below 600, it will start showing red square.
Ok, now let us start analyzing the other options which is entering manual information KPI, it is very simple process of giving static data. You just need to give a value and select the criteria goal for it and it simple displays the image depending on the value that you have entered like shown below.
You can also create a KPI indicator which will come from the excel file. But before starting on this, you need to create SSP for this, because the excel file that we are going to use here must be under the trusted location. So create the SSP from central administration and click on the excel trusted file location. Give the entire path till your library name in which your excel book resides. Once you are done with this, then only you will be able to use this feature. So go ahead and create one more KPI indicator and this time select the indicator using data in excel work book. Once you click on this, you need to give the URL of the workbook. So go ahead and select your work book. Now here, once you select the workbook, you need to give the cell number here to mention your indicator value. Along with this you also need to give the cell number for goal and cell number for warning.
This is the snapshot of excel workbook that I have created. In this workbook, in Shhet1 I have mentioned Sales data.

Here D11 cell is an average of sales goal value of D4 to D8 which is our target value as indicator. H$ value indicates the goal to achieve and H7 is the warning sales goal. So let’s specify these values in respective field as shown below.

Just see at the indicator field in KPI list,
Let’s prepare one workbook which look like this, here D11 is calculated column which is average of all sales figures. Cell H4 represents the goal to be achieved and cell H6 represents the warning match.
So here we will specify our criteria like shown above in workbook figure.
Go ahead and have a look at the KPI list how it looks like.

Try to open the workbook for editing and see the changes in the indicator values, you will see different indicators shown in the KPI list.
Now, we are almost done with our examples of KPI. Just one more topic left to discuss which a KPI web part is. We are done with creating KPI list, its supporting list but there is one more thing, which is web part that supports the KPI list. So let’s go ahead and add web parts. Click on edit page, where you want to put this web part. This web part will basically pulls the KPI data from the KPI list and shows details at one go.
Find web part which is named “Key Performance indicators” under Dashboard category. Once you add it, click on modify shared web part and select the KPI list.

One more web part is there which says KPI Details under same Dashboard category. So go ahead and add that web part on the page, click on modify shared web part. Select KPI list, here you will find all KPIs that you have mentioned in the KPI list in the drop down. From there you can select KPI. In this example, I have selected the excel sales data calculation KPI and selected icon as checkmark and result is shown below.

That is it. i will soon come with part 2.
0 comments:
Post a Comment